Key takeaways
- A single operating picture is one trusted, current view that merges signals from every system your operation depends on.
- Workers toggle between applications roughly 1,200 times a day, losing about 9% of their annual time at work (Harvard Business Review, 2022).
- The average company runs 106 SaaS applications, and large enterprises run 131, which fragments operational data across many tools (BetterCloud, 2025).
- Operations visibility improves when you reconcile conflicting data to one source of truth instead of adding more dashboards.
- A view becomes useful when actions, including approvals, happen inside it rather than in a separate tool.
A single operating picture is one trusted, continuously updated view that merges the signals from every system your operation depends on. It lets an operations team see orders, inventory, tickets, staffing, and finance together, then act on what they see without hopping between tools.
Most operations leaders do not lack data. They lack a place where the data agrees with itself. Information sits in an ERP, a CRM, a ticketing queue, a spreadsheet, and three chat threads, and reconciling it by hand eats the day. This article explains what a single operating picture means, how to pull signals from many systems into one view, how to avoid dashboard sprawl and conflicting data, and how to make the view something people act on.
What a single operating picture means and why it matters
A single operating picture is the shared, current view of how your operation is running right now, assembled from every relevant system into one screen. It matters because fragmented data forces people into constant manual coordination, and that coordination is expensive.
Consider how much of the day gets lost to app switching. In a 2022 study of 137 users across three large companies, researchers found that workers toggled between applications roughly 1,200 times each day and spent just under four hours a week reorienting themselves afterward, about 9% of their annual time at work (Harvard Business Review, 2022). For an operations team that lives inside many tools, that toll lands hard.
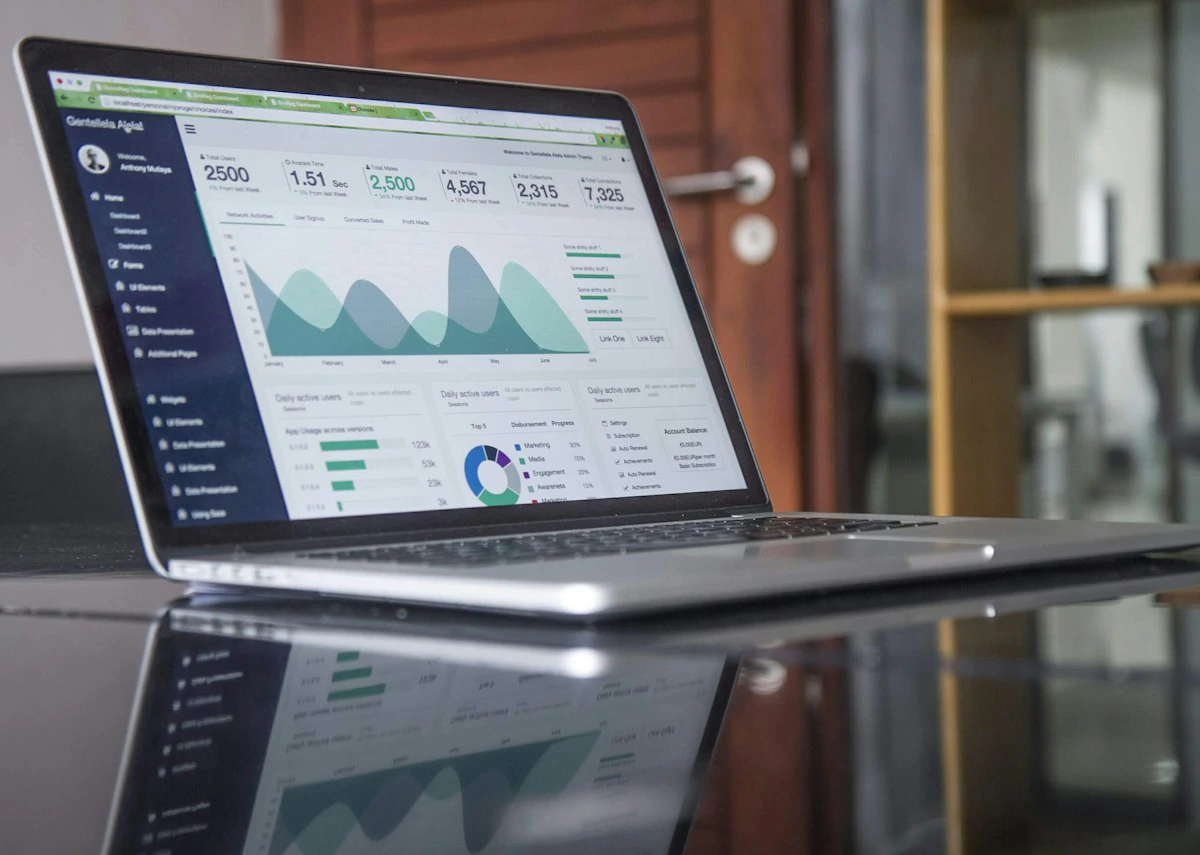
The point of a single operating picture is to remove that tax. When the facts live in one view, people stop stitching reports together and start making decisions. A good operating picture answers three questions at a glance: what is happening, what needs attention, and what should happen next.
Pulling signals from multiple systems into one view
Building the view starts with connecting the systems that already hold your operational truth, then normalizing their signals so they can sit side by side. The scale of the problem is real: the average company runs 106 SaaS applications, and large enterprises with 5,000 or more employees run about 131 (BetterCloud, 2025).
You do not need to pull everything. Start from the decisions your team makes most often, then trace each decision back to the systems that feed it. A fulfillment lead might need order status, inventory levels, carrier updates, and open exceptions. That maps to maybe four or five systems, not forty.
For each connected system, decide three things:
- Which entities matter (orders, SKUs, tickets, accounts).
- How often the signal needs to refresh (live, hourly, daily).
- Which fields are authoritative when two systems disagree.
This is where KaiMesh fits. Its platform connects multiple business systems into one operating picture, so an operations team can read across tools without exporting and merging data by hand. The goal of this layer is modest and specific: get the right signals into one place with a clear rule for which system wins when they conflict.
Avoiding dashboard sprawl and conflicting data
More dashboards rarely mean more clarity. Sprawl happens when every team builds its own view, each tool reconciles data differently, and two screens show different numbers for the same thing. The fix is to reconcile data to one source of truth per data type, then retire the duplicates.
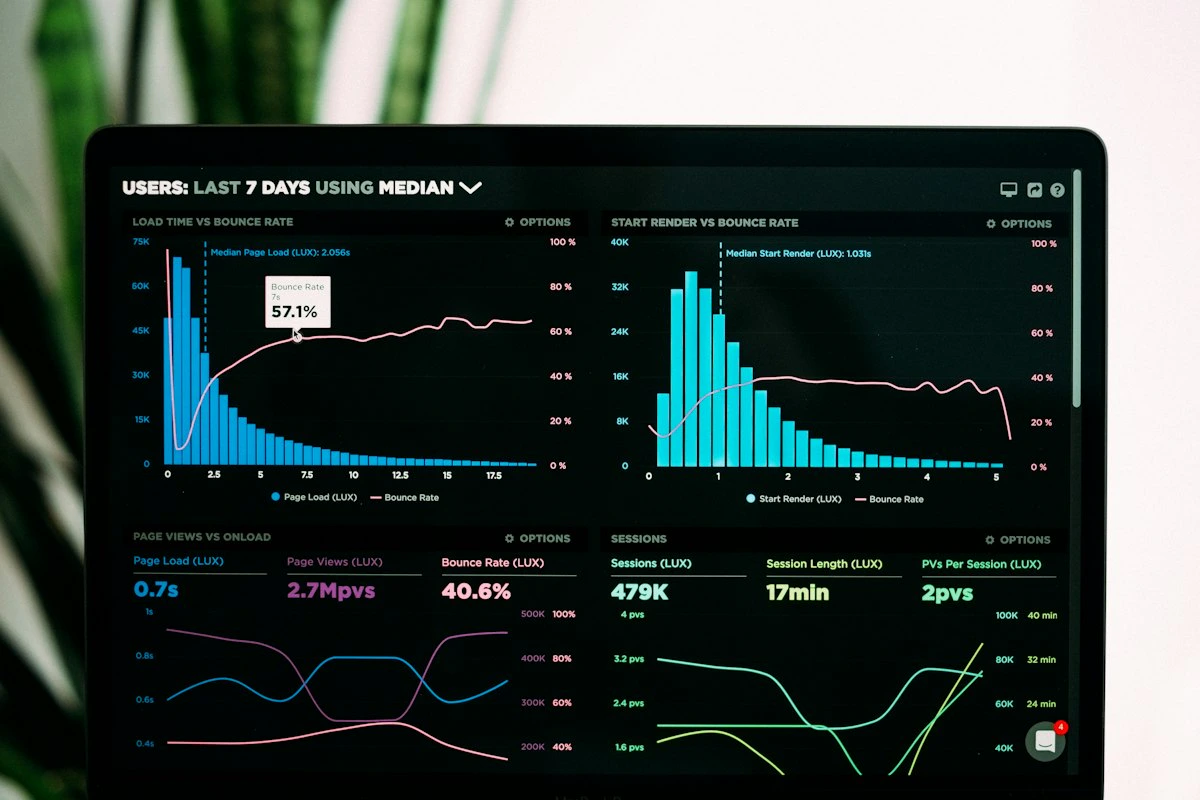
Conflicting data is corrosive because it erodes trust in the view itself. Once a team catches two dashboards disagreeing, they go back to pulling their own spreadsheets, and the single operating picture quietly dies. Guard against that with a few disciplines:
- Name one authoritative source for each field, and display where each number came from.
- Show the timestamp on every signal so people know how fresh it is.
- Collapse near-duplicate dashboards into one, rather than adding a new tab.
Decision quality suffers when leaders cannot trust what they see. McKinsey's research on organizational decision-making describes how few companies feel confident in both the quality and the speed of their decisions (McKinsey & Company). A reconciled view does not fix decision-making on its own, but it removes a common excuse: not knowing which number to believe.
Ask a blunt question of any new chart before you build it: which decision does this change? If the honest answer is none, it is sprawl, not visibility.
Making the view actionable with embedded approvals
A view earns its keep when people can act inside it, not just look at it. The highest-value action in operations is usually an approval: releasing a shipment, clearing a credit hold, authorizing overtime, signing off on a vendor change. When approvals live in a separate email thread, the operating picture becomes a read-only report.
Embedding approvals means the person who spots the exception can resolve it in the same view, with the context already attached. The request shows what is being approved, which systems it will touch, and who signed off. That keeps a human in the loop while removing the swivel-chair work of copying details into another tool.
This is a capability KaiMesh ships directly. Its human approval workflows sit on top of the connected operating picture, so an action proposed from the data can be reviewed and approved in place, then written back to the relevant system. The pattern matters for operations because it closes the gap between seeing a problem and doing something about it, without handing control to automation that runs unsupervised.
Keep approvals lightweight. Route each one to a single clear owner, show the few facts needed to decide, and record who approved what and when. An approval queue that demands five clicks and a login to a second system will be ignored, and the view will slide back toward being a passive dashboard.
Example operating picture for a mid-size ops team
Picture a 300-person distributor with a lean operations team of six. Their work spans an ERP for orders and inventory, a CRM for accounts, a helpdesk for customer issues, a warehouse system, and a finance tool for credit and billing. Before building a single operating picture, each morning started with four exports and a merged spreadsheet.
Their consolidated view brings together a handful of signals that drive the day:
- Open orders flagged as at risk, with the reason pulled from inventory or carrier data.
- Credit holds blocking shipment, with the account balance from finance attached.
- Support tickets tied to specific orders, so service and fulfillment see the same case.
- Staffing against the day's expected volume.
When an at-risk order appears because a credit hold is blocking it, the finance lead sees the balance and the order in one place and approves release from the same screen. The approval writes back to the ERP, the hold clears, and the warehouse sees the order move to ready. No spreadsheet, no email chain, no second login.
The payoff shows up as fewer handoffs, faster clearing of exceptions, and a team that trusts the numbers enough to stop building private copies of them. That is what operations visibility buys when the view is both unified and actionable.
If you are starting from scattered tools, pick one recurring decision your team makes every day, map the two or three systems that feed it, and build a single view for just that decision first. Prove the value on one workflow, earn the team's trust in the data, then widen the picture from there.
Frequently asked questions
What is a single operating picture?
It is one shared, continuously updated view that combines the signals your operation depends on, such as orders, inventory, tickets, and finance, so everyone works from the same facts instead of separate tools.
How is a single operating picture different from a dashboard?
A dashboard usually reports one system or metric set. A single operating picture reconciles data from many systems into a trusted view and lets people take action, including approvals, without leaving it.
Why does operations visibility matter?
Clear visibility reduces manual coordination, cuts the time people spend switching between apps, and helps leaders decide faster because they trust that the numbers in front of them are current and consistent.
How do you avoid dashboard sprawl?
Define the few decisions the view must support, reconcile conflicting fields to one source of truth per data type, and retire dashboards that duplicate those answers rather than adding new ones.